Tagged as: Graphing
Primary, Preschool, and Kindergarten Graphing: What Does it Look Like?
Data analysis is something that children begin to become acquainted with at an early stage. In preschool and kindergarten graphing starts with organizing information and modeling it in different ways. The books and activities that adults provide can be a wonderful starting point for analyzing data in interesting and mathematical ways. And of course, as children go on to first grade, second grade, and beyond, the graphing can become more complex.
Series: Book Ideas
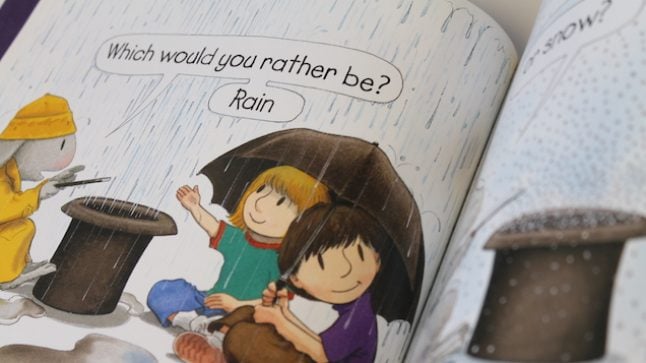
3 Books That Encourage Simple Graph Explorations with Young Ones
March 24, 2019
At the heart of it, graphing in the early years is about quantifying information in order to answer a question. That requires children to organize data in some visible way so that comparisons and generalizations are possible.
- Topic: Data Analysis
- Age/Grade Level: Pre-K, Kindergarten, 1st Grade
- Tags Graphing, Shoes, Comparing, Mitsumasa Anno, Anno’s Flea Market, Which Would You Rather Be?, William Steig, Whose Shoes?, Stephen R. Swinburne
Series: Ideas at Work September 20, 2017
A Flurry of Ideas for Winter Math Activities
It’s autumn, which means there’s a feeling that cold weather is on its way. A small comfort in the changing weather is that it offers some opportunities for winter math activities.
- Topic: Number Operations, Measurement
- Age/Grade Level: Pre-K, Kindergarten, 1st Grade, 2nd Grade, 3rd Grade
- Tags Graphing, Shoes, Seasonal, Nature
Series: Book Ideas March 14, 2017
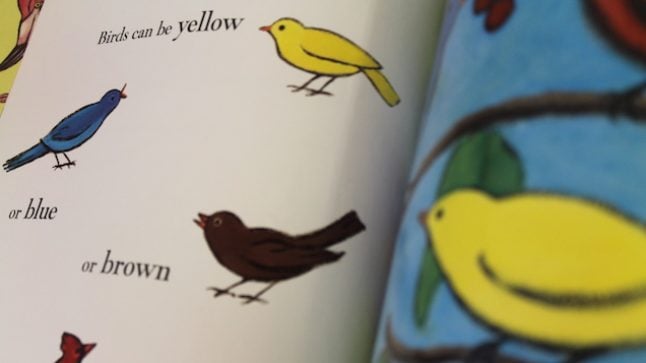
3 Animal Picture Books That Explore Questions About Data
Data analysis uses math to make sense of the world. It is compiling information and describing it in a quantitative way: how many?
- Topic: Data Analysis
- Age/Grade Level: Pre-K, Kindergarten, 1st Grade
- Tags Animals, Graphing, Tiger Math: Learning to Graph from a Baby Tiger, Ann Whitehead Nagda, Cindy Bickel, How Many Snails?: A Counting Book, Paul Giganti Jr., Birds, Kevin Henkes
Series: Focus on Collaboration October 18, 2015
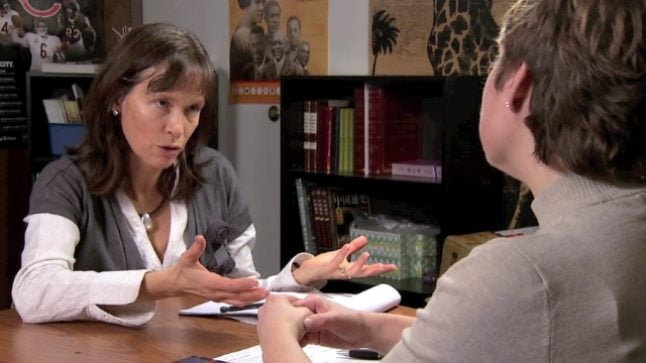
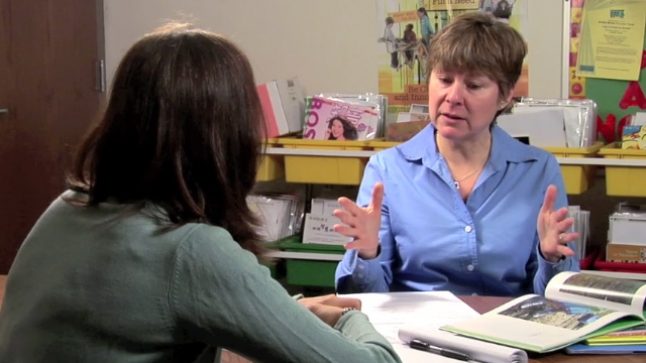
Reflecting Conversation for Shoe Graph Lesson
In this conversation, a teacher reflects on the successes and difficulties of a recent lesson. With a coach, she discusses the successes of the lesson, as well as details to improve on next time.
- Age/Grade Level: Pre-K, Kindergarten
- Tags English Language Learner, Graphing, Shoes, Seasonal, Books
Series: Focus on Collaboration October 17, 2015
Planning Conversation for Shoe Graph Lesson
In this planning conversation, a teacher and coach discuss some of their ideas and concerns about a forthcoming lesson. With a coach, she discusses some of her ideas and concerns about the forthcoming lesson.
- Topic: Data Analysis
- Age/Grade Level: Pre-K, Kindergarten
- Tags English Language Learner, Graphing, Shoes, Seasonal, Books, Planning
Series: Focus on the Lesson December 17, 2014
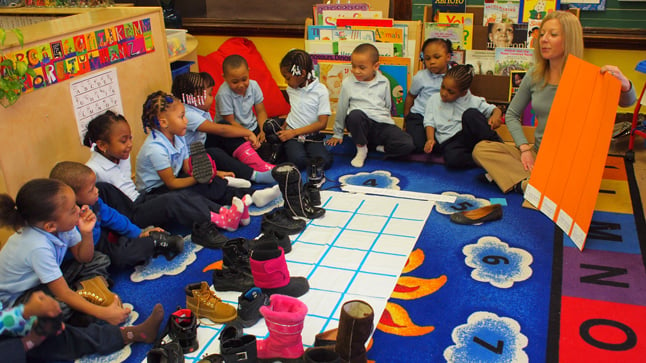
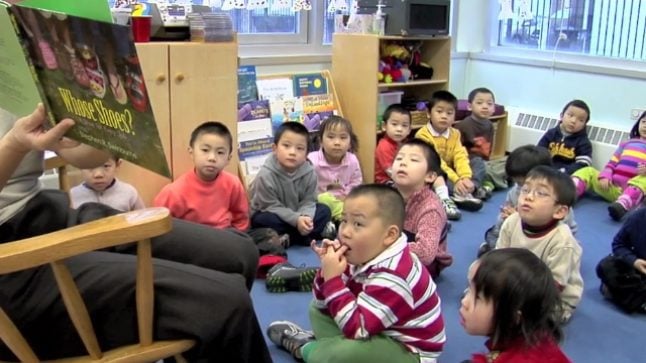
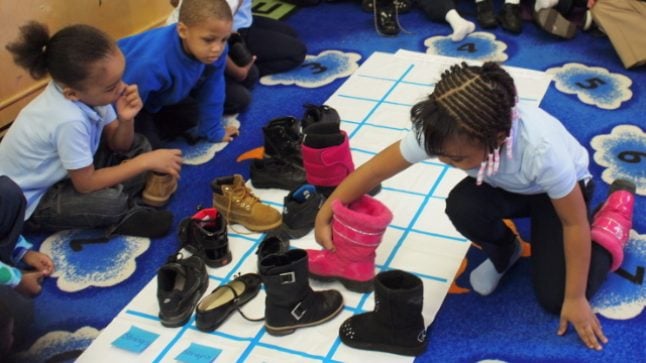
Shoe Graph
In this video, students brainstorm ways to sort their shoes. Later, they graphically organize the data from the sets they created.
- Topic: Data Analysis
- Age/Grade Level: Pre-K, Kindergarten
- Tags English Language Learner, Graphing, Shoes, Seasonal, Books, Whose Shoes?, Stephen R. Swinburne
Series: Ideas at Work February 14, 2013
Algebraic Thinking with Shoes
Cindy Collado and her preschool class at Stock School were involved in a shoe project that incorporated many math concepts through a variety of activities over the course of two months. The class started by…
- Topic: Data Analysis
- Age/Grade Level: Pre-K, Kindergarten
- Tags Graphing, Shoes
Do the math.
Free videos.
Free newsletter packed with ideas.
Free professional learning modules.