• About
  • Projects
  • Contact
  • Join
  • Login
Erikson Institute Early Math Collaborative
Early Math Collaborative
  • Español de México
  • Why Early Math?
    Our Mission Big Ideas of Early Math Precursor Concepts Racial Justice
  • Professional Development
    Whole Teacher Approach Learning Labs Instructional Coaching Leadership Academies Our Books
  • Online Learning
    Our Resources Professional Learning Modules Series
  • Research
    Teacher Development Publications Presentations Measuring Math
  • Events
    Summer Institutes Promising Math Racial Justice in Early Math Webinar Series Who Is Labeled Smart Webinar Engaging Families and Communities Webinar Centering the Brilliance of (Im)migrant Children Webinar
  • Ideas
  • Why Early Math?
    • Our Mission
    • Big Ideas of Early Math
    • Precursor Concepts
    • Racial Justice
  • Professional Development
    • Learning Labs
    • Instructional Coaching
    • Leadership Academies
    • Our Books
  • Online Learning
    • Online Learning
    • Professional Learning Modules
    • Series
  • Research
    • Teacher Change
    • Publications
    • Presentations
    • Measuring Math
  • Events
    • Summer Institutes
    • Promising Math
  • About
    • About
    • Projects and Partnerships
    • Contributors
    • Contact
  • Language Switcher
    • English
    • Español de México
  • Ideas
  • MyDashboard
  • Login or Join Today
what-is-data-analysis-graphing-for-kids-1200x800

Big Ideas of Data Analysis

Big Ideas of Data Analysis

  1. Big Ideas
  2. Data Analysis

ideas data analysis and graphing for kids what is data analysis

Data Analysis

For many early childhood teachers, the words “data analysis” are associated with detailed charts and graphs, computers, and sophisticated ways of analyzing numbers. Other teachers know that data analysis can be very simple, like making a list of items and writing how many you have of each in parentheses, or creating and talking about a bar graph whose bars are higher for snowy than rainy days in the month of January. Whether the process involves specialized statistical software or markers and chart paper, what remains the same is that data analysis gathers information in a quantitative way (how many?), and then organizes it in some way that makes comparison and generalization possible.

Copyright: Erikson Institute’s Early Math Collaborative. Reprinted from Big Ideas of Early Mathematics: What Teachers of Young Children Need to Know (2014), Pearson Education.

Big Ideas

● It is useful to compare parts of the data and to draw conclusions about the data as a whole.
● Data must be represented in order to be interpreted, and how data are gathered and organized depends on the question.
● The purpose of collecting data is to answer questions when the answers are not immediately obvious.

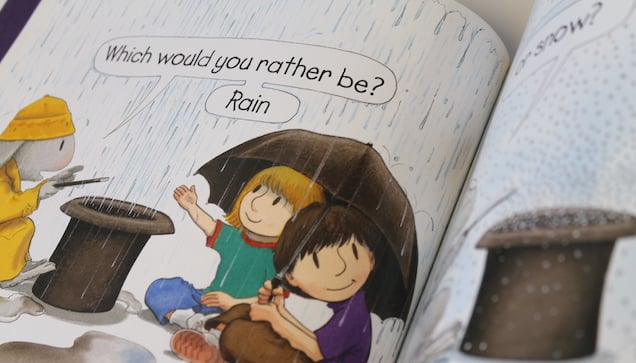
Interested in Book Suggestions?

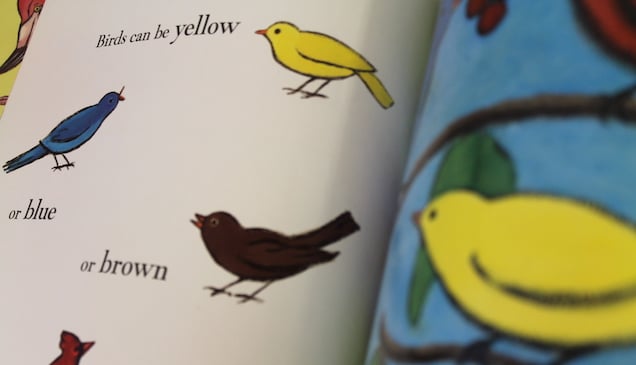
Browse our favorite children’s books that explore Data Analysis.
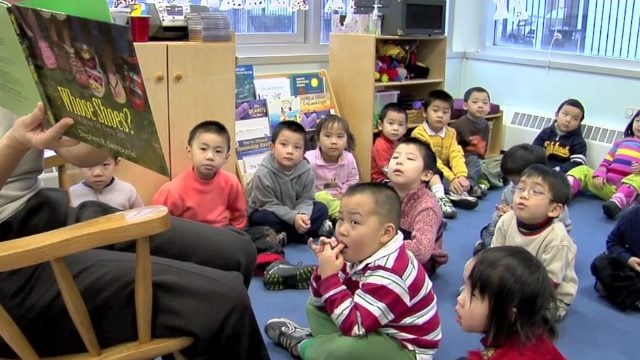
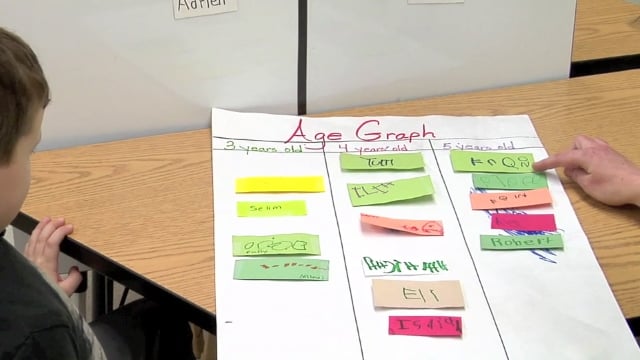
Learn more

simple graph graphs for kids graphing for kids what is data analysis in math books

3 Books That Encourage Simple Graph Explorations with Young Ones

At the heart of it, graphing in the early years is about quantifying information in order to answer a question. That requires children to organize data in some visible way so that comparisons and generalizations are possible.

EMTR081-1 3-5 year old childrens education programs graphing for kids what is data analysis

Shoe Graph

In this video, students brainstorm ways to sort their shoes. Later, they graphically organize the data from the sets they created. Allowing children to define their own shoe categories involves them in important mathematical thinking – making sense of a problem and persevering in solving it, and constructing viable arguments and critiquing the reasoning of others.

The Math in Learning Names

Do the children in your classroom know each other’s names? At winter break, are they still pointing to “that girl?” Doing activities in the early weeks of school that use the children’s own names will do wonders for building your classroom community. At the same time, you can be doing math—as well as literacy!

what is data analysis in math books

3 Animal Picture Books That Explore Questions About Data

Data analysis uses math to make sense of the world. It is compiling information and describing it in a quantitative way: how many?

graphing with kids what is data analysis

Age Chart with Child 27

A child explains the function of a chart in his classroom. Focus on the Child videos are taken from one-on-one interviews with individual children. The interviews are designed to elicit evidence of children’s mathematical thinking.

Browse all that match this in our Idea Library.

Big Ideas of Early Mathematics:

What Teachers of Young Children Need to Know

The Big Ideas that convey the core concepts of mathematics are at the heart of this book that gives early childhood educators the skills they need to organize for mathematics teaching and learning during the early years.
Order a copy

Online MS in Early Childhood Ed – STEM Focus

Get your degree online!

Elevate your practice and strengthen your knowledge of teaching and learning in the disciplines of science, technology, engineering, and mathematics (STEM), with an emphasis on children in preschool through third grade.
Find out more

Do the math.


Free videos.

Free newsletter packed with ideas.

Free professional learning modules.


Join the collaborative

This field is for validation purposes and should be left unchanged.

EN
EN
ES
  • Facebook
  • Twitter
  • Youtube
  • Contributors
  • Jobs
  • Funders
  • Legal Policies

Early Math Collaborative 451 N LaSalle Street, Chicago, IL 60654

© Erikson Institute, All Rights Reserved.

  • Erikson Institute
  • The Early Math Collaborative is part of Erikson Institute, the nation’s premier graduate school in child development.

  • Visit Erikson.edu