Series: Ideas at Work
Analyzing Data with Surveys
At one learning lab, participants observed a fun project tradition. As has been true for years, the authors of this year’s Idea Book were in the room for its unveiling and discussion. The Idea Book allows program participants to submit write-ups and photos of activities they used to make their math lessons more engaging and to put their own spin on the research lessons discussed in the learning labs. They are organized according to the major content strands and printed in a spiraled book so that even though the program is over, these Big Ideas remain accessible and inspiring for years to come.
Since a recent session addressed important ideas of geometry, the discussion of data analysis didn’t get much attention—in the workshop, that is. However, the Idea Book includes a variety of great ways to make surveys and analyzing data meaningful, engaging activities.
Heather Duncan did a particularly striking job of explaining how she and her kindergartners at South Shore Elementary have made collecting data from surveys and discussing them a regular part of their classroom life.
Heather prefaced her description of their process by pointing out how important it is to take time to really explore the ideas and emphasize the children’s work and thinking. She typically does a process that stretches from three to five days and always ends up with a product everyone can see.
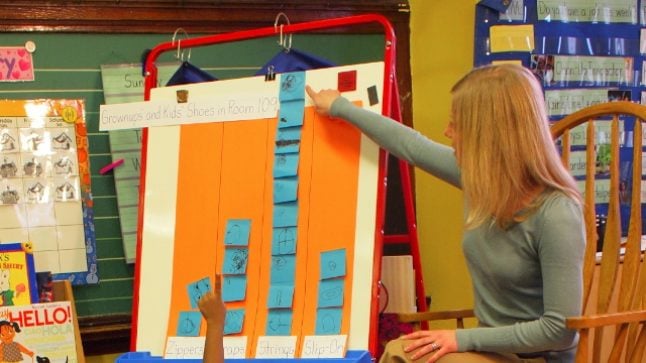
- Day One, they collected results of a survey, usually related to a topic they were already studying. For example, while studying the human body, Ms. Duncan had them compare each student’s height to a cut-out of an average kindergartener hung up in the class.
- Day Two, they synthesized the results. “We used the chart,” she wrote, “to count and determine totals for each designation (taller, shorter, same size) and whether any groups have more/less or the same amount as any others. We also compare totals from the a.m. class with the p.m. class and discuss any similarities or differences in results.”
- Day Three, they further discussed the results and talked about the best way to show them on a graph. In this case, they decided on a bar graph.
- Day Four, they used the resulting graphs to make some conclusions. She wrote, “Which group had more or the most? Which had less, the least, or the fewest? What do we know about the question or our class as the result of our survey?”
They turned the results into a poster, a bulletin board display, or part of a “trivia book” at the end of the school year. Ms. Duncan comments, “[The activity] has since become practice, because we have found it to be a very rich experience. It’s been invaluable using math in context to study things we care about and to answer questions generated from our own interests.”
-

Common Core Alignment
Measurement and Data Read More
-

Foundational Math Topics
Read more about Data Analysis